
Learn more about Dailytics
Let's dive into the details of how Dailytics works.
Once you are ready, you can start your 15-day free trial.
What is Dailytics?
Dailytics is not an alternative to Google Analytics, Fathom, Plausible or other analytics provider, so you don't need to install any script in your website.
It is a service that connects to your analytics provider and generates a custom report based on your current stats and sends it to your email inbox and Slack workspace every day.
You will see here a preview of all the widgets you can include in your email reports. The same widgets can be included in your Slack reports (you can see a preview in that link).
First look at your inbox
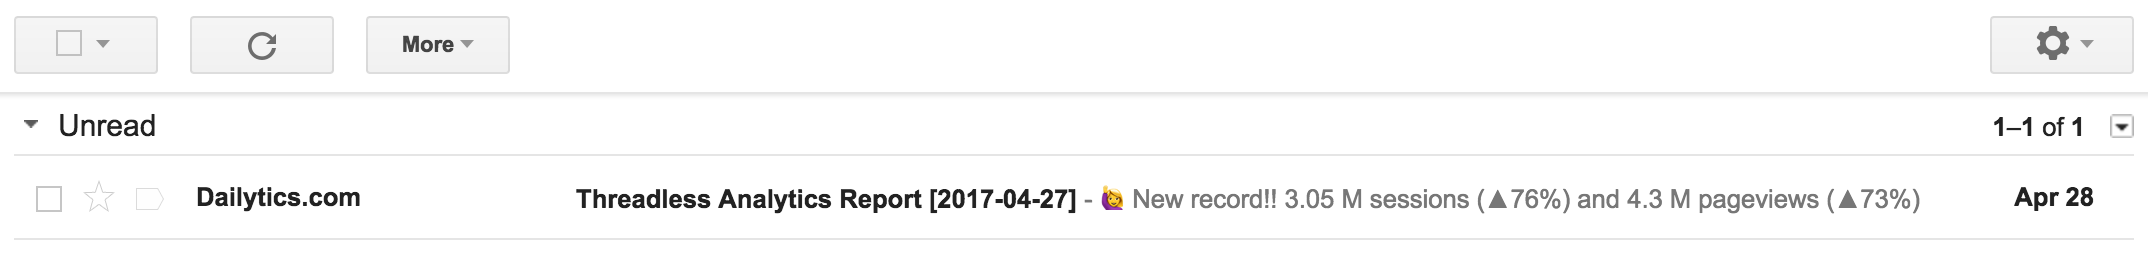
All reports will be sent from Dailytics.com <[email protected]> by default, but you can customise this with the Enterprise Plan.
Your logo and key metrics
When you create a report you must define if you want to compare your analytics vs last week, last month or last year. Here are those metrics.
We'll add a medal in the case you hit a new record!
The most visited article/product
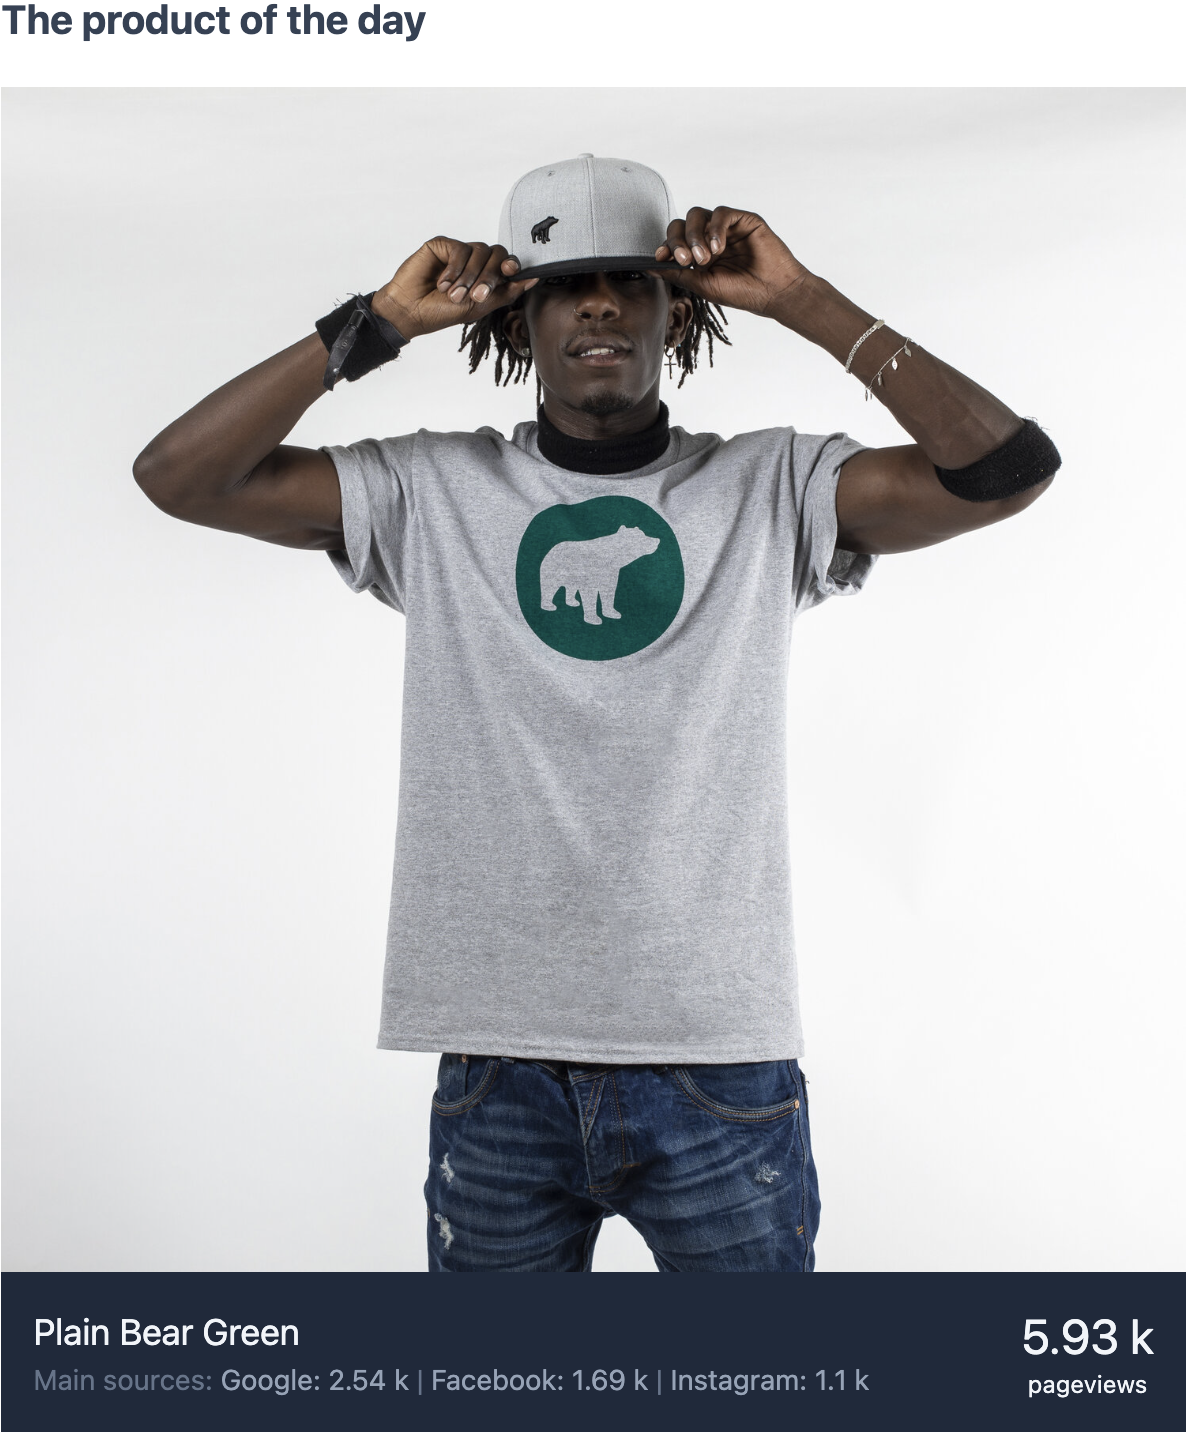
This is one of the most favorite elements of the report: We'll get the most visited page and will try to find the most relevant image (it will help if you use the Open Graph metadata). You will also see the main sources of traffic to that page.
Of course, you will be able to filter this element by source or by a page_path (with regular expressions), so you could see the most visited product from facebook, from Google, or the page that matches this path /products/.
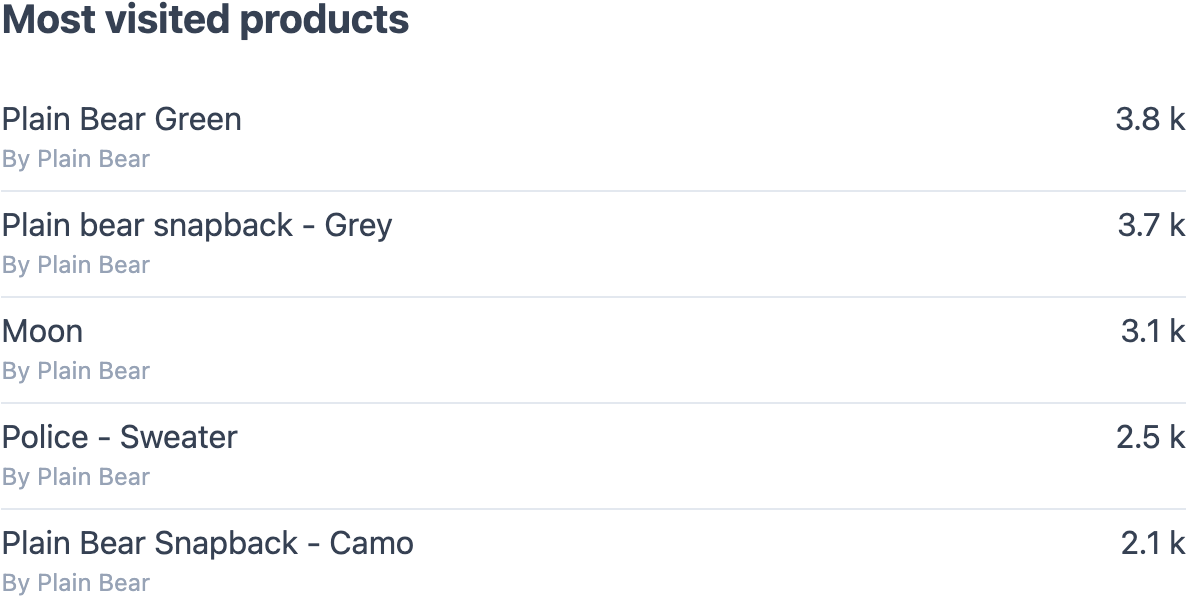
Top 5 lists
You can create as many lists as you want, filtering them by source or by page_path (with regular expressions).
Thus, you can have the "Top 5 products from Google" (filtering by source: Google and page_path: /products/), or "Top 5 news from the Newsletter" (filtering just by source: mail)
We'll do our best to find any Author of that page and we will include the author's name here too.
Top Referrers
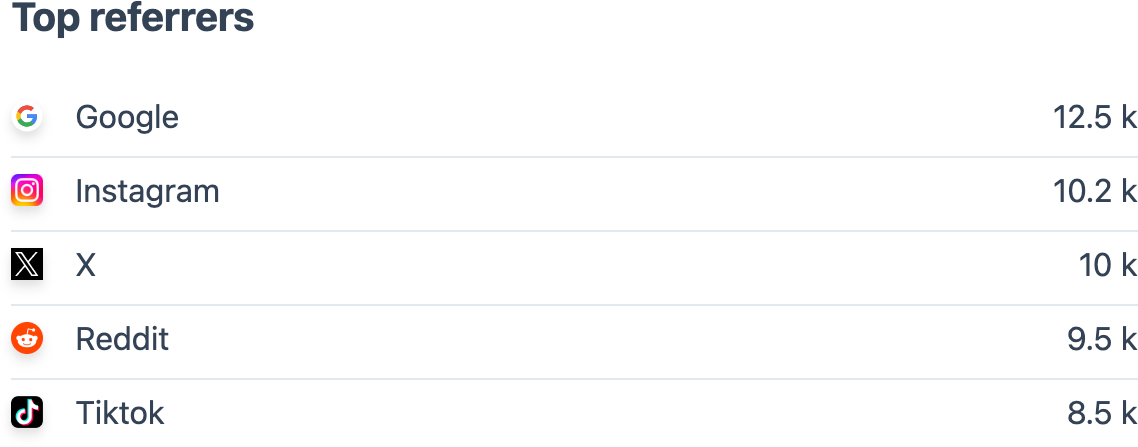
You can create as many lists as you want, filtering them by source or by page_path (with regular expressions).
Thus, you can have the "Top 5 products from Google" (filtering by source: Google and page_path: /products/), or "Top 5 news from the Newsletter" (filtering just by source: mail)
We'll do our best to find any Author of that page and we will include the author's name here too.
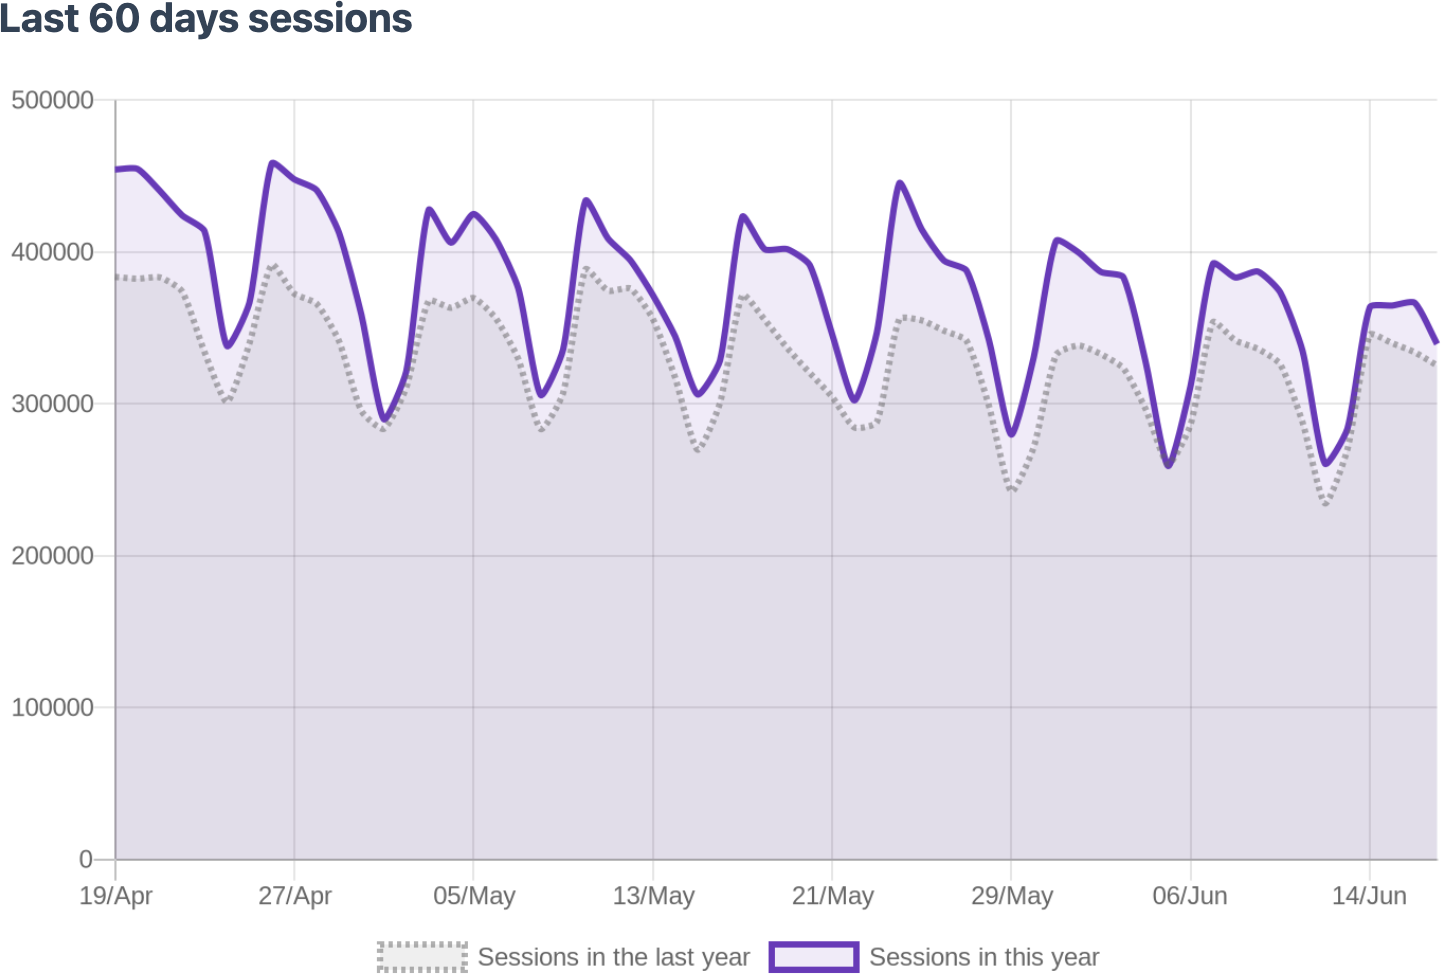
Last 60 days charts
Again, you can add as many charts as you want, filtering by source or by page_path. So you can have a chart with "Sessions from Social Networks" (filtering by source: twitter|facebook|pinterest) or "Pageviews to the Technology Section" (filtering by page_path: /category/technology/)
If you filter by page_path, then the chart will be about pageviews. If you filter just by source it will be about sessions
Every chart is compared against the same 60 days of the previous year (we'll make sure we are comparing Mondays with Mondays)
Multi Series Chart
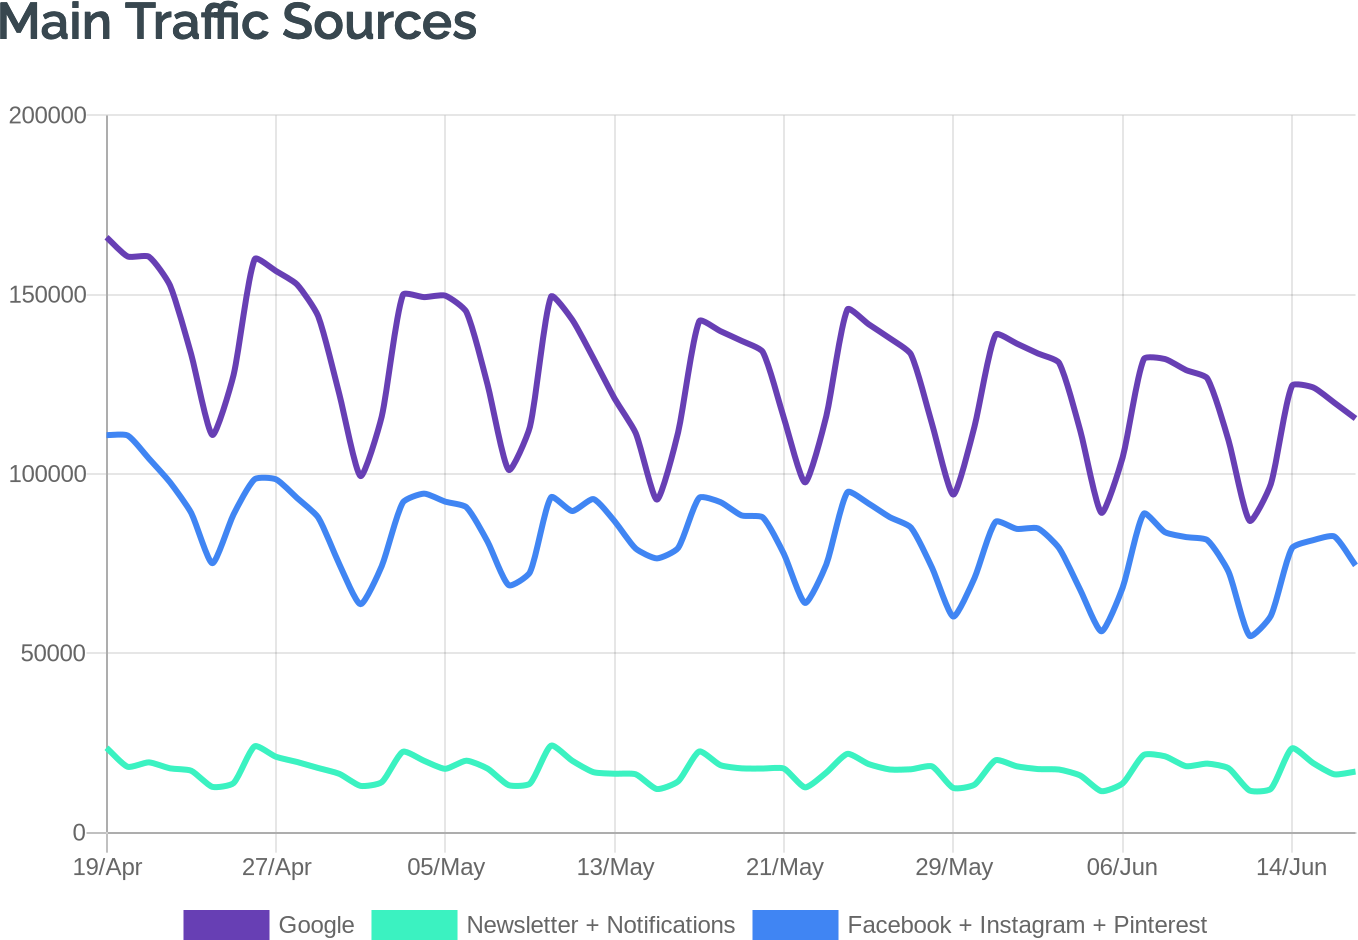
Once again, you can add as many multi charts as you want, filtering each serie by source or by page_path. So you can have a chart with "Main Traffic Sources" setting each serie with a source filter.
You can also filter each serie by page_path so you can visualise easily up to 3 different important pages for your business, for example, track the conversion rate like this:
- /product/[0-9]+ (the page views to your Product pages)
- /payment (the page views to the Payment page)
- /thanks (the page views to the Thank You page)
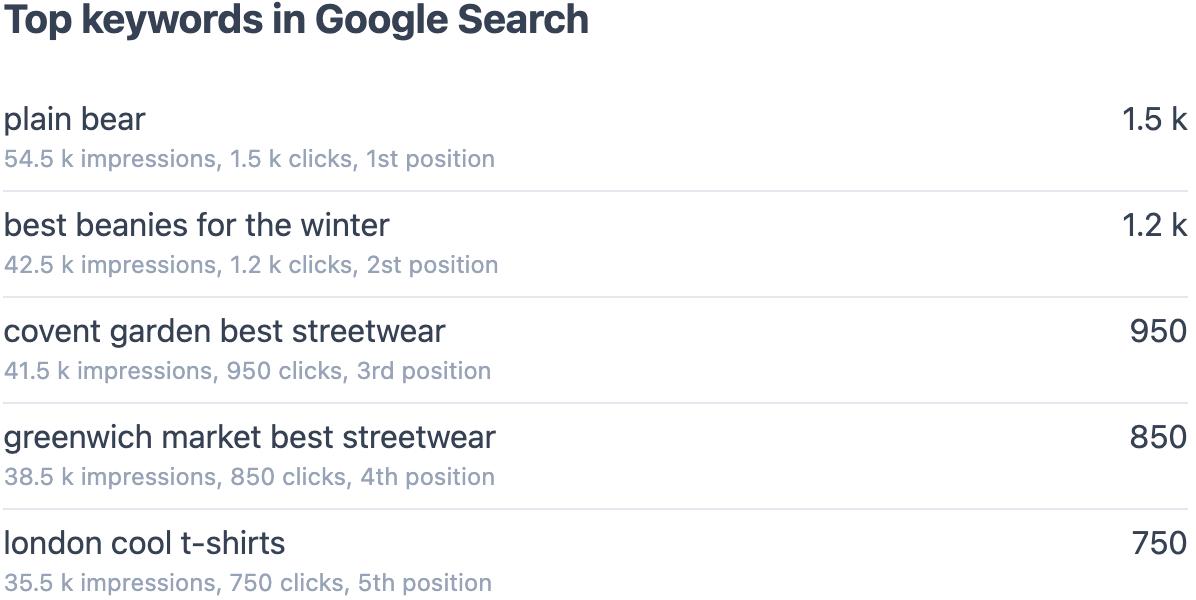
Top queries in Google Search
If you connect your report to your Google Search Console account, you will be able to include this widget, that lists the top queries in Google Search in the report's period.
This list will include the number of impressions, clicks, and the average position for each query.
Impressions and clicks in Google Search
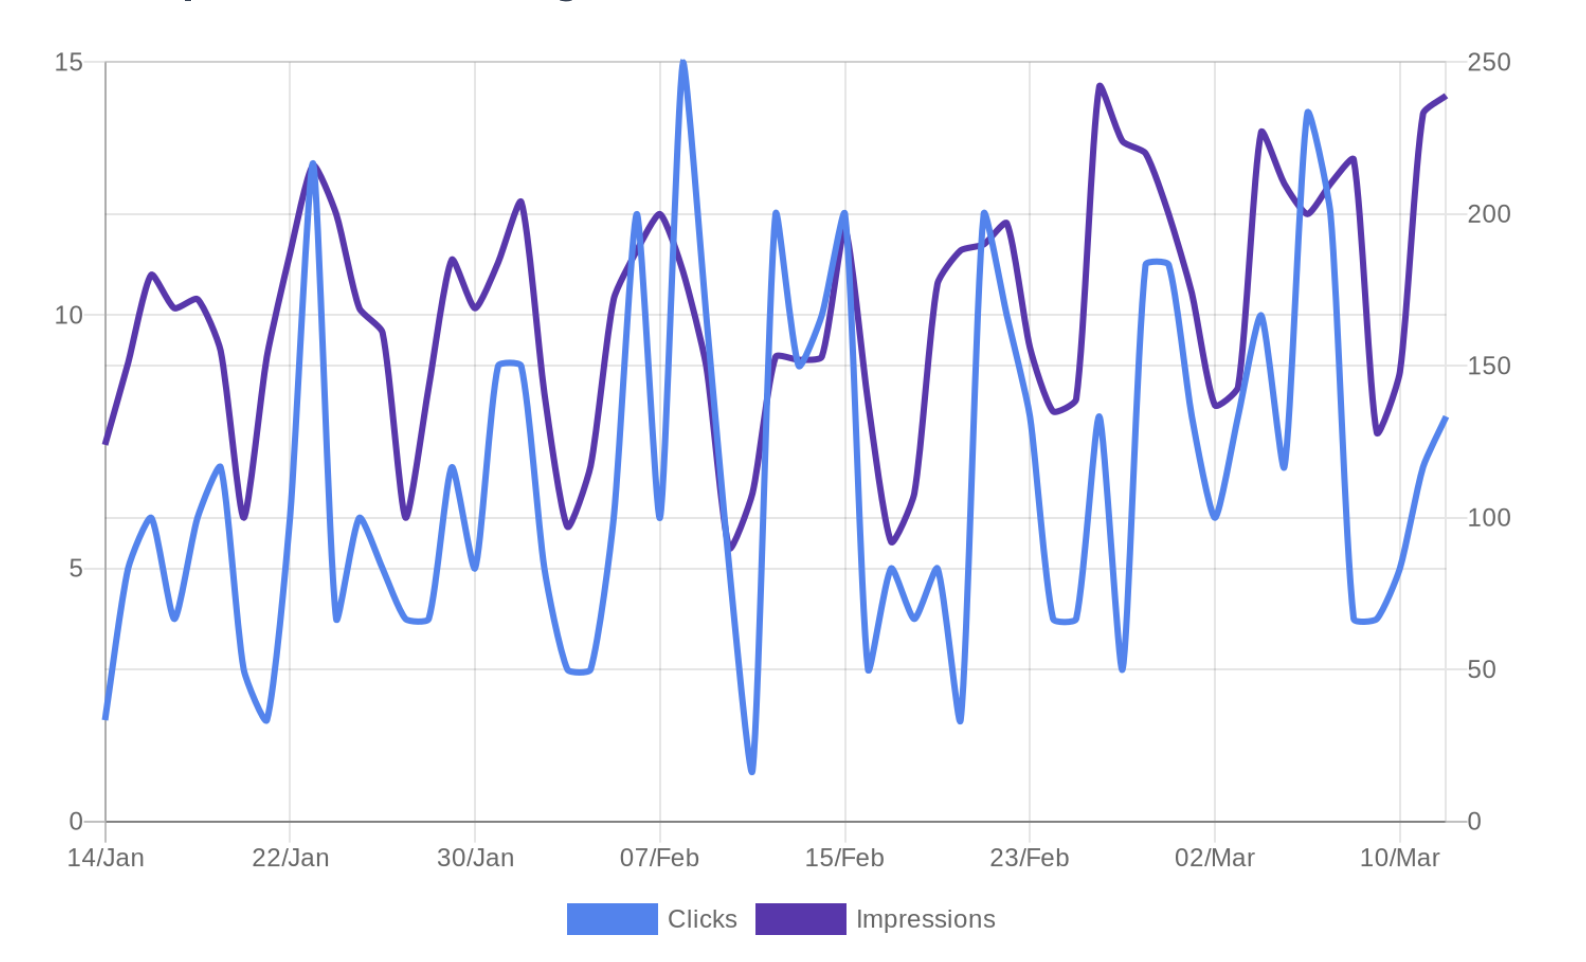
If you connect your report to your Google Search Console account, you will be able to include this widget, that visualises the daily impressions and clicks from Google Search (60 days window, too).
This chart is very similar (same colours too) to the one you can find when visiting your Google Search Console account, but it will be in your Inbox (or Slack), daily.
