Daily analytics reports for Fathom Analytics
Create a custom report connected to your Fathom Analytics account
and receive it in your inbox or Slack!
every day/week
You won't need that cookie banner anymore!
Fathom Analytics is one of the main players (along with Plausible Analytics) in the field of privacy-friendly analytics providers, which makes it a very good alternative to Google Analytics if you are looking for a simpler, cookie-free solution for your statistics.
You can see a live demo of their dashboard so you can understand what you will get from them.
Want to give Fathom a try? Use this link and get $10 off:
Who is Dailytics for Fathom for?
If you run your own website and are a statistics enthusiast, you probably have a window with your Fathom Dashboard open all day long... Unfortunately, I'd say Dailytics is not for you.
On the other hand, if you're not the kind of person who's looking at stats every day and just want to get a glimpse of "what's going on", or if you work with a team and would like to keep them up to date and motivated, then you might see value in our offer.
Finally, in case you run a digital agency and you built a site for a client, you can also setup a report, put your agency's branding there and surprise them with a lovely report. We can even send this report from your own address ([email protected])
How to build your email report from Fathom?
Make sure you have access to the new API feature at: Settings > API and create a new API Key for Dailytics.
Then go to "Create report" and put that API key there. All your sites will load automatically so you can choose the site you want to create the report for. Make sure you also choose the timezone you want to use for your stats.
As always, you will be able to add unlimited "widgets" and add filters to each of them.
The basic filters are pagepath, source and hostname but you will be able to add advancend filters too! See the official documentation (the "Aggregation" section) too learn about the different options you have to filter.
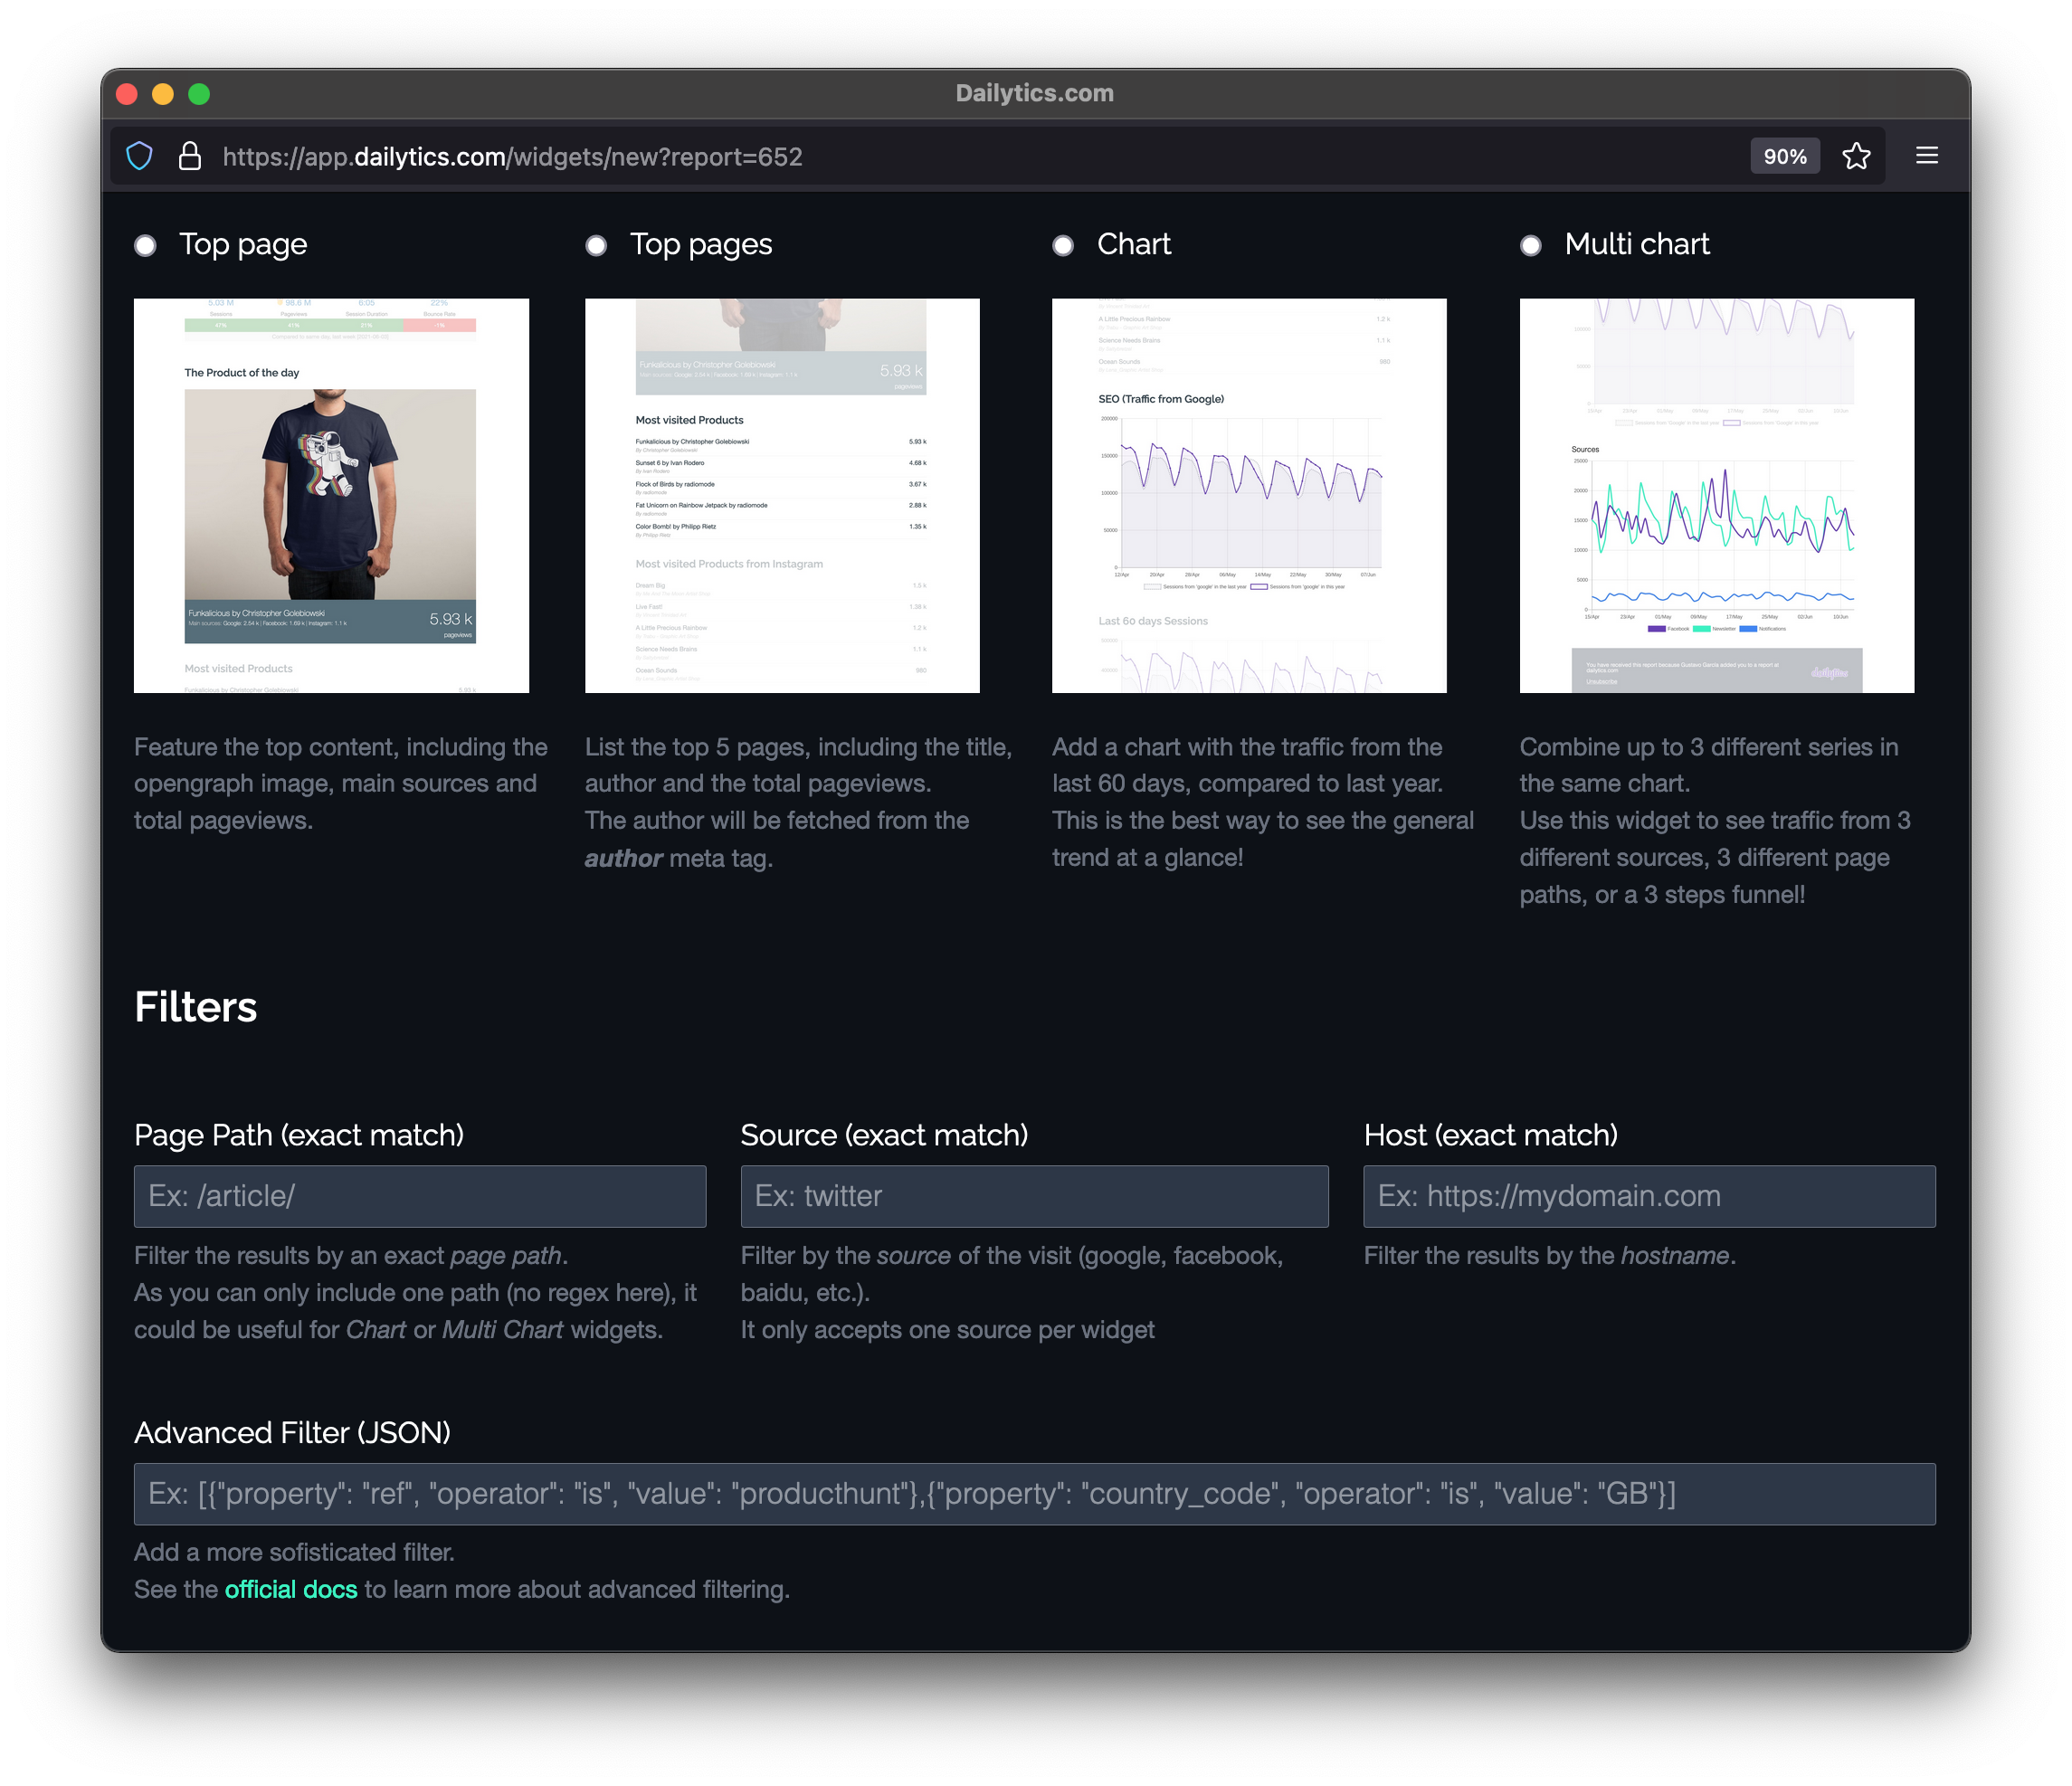
Let's see an example
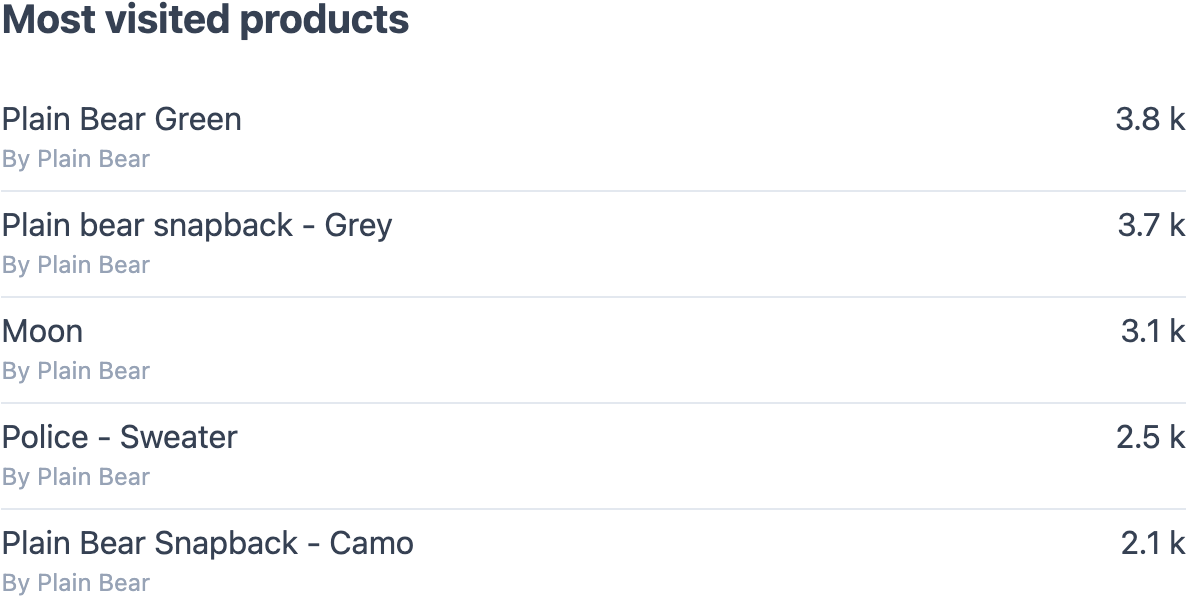
Most visited products
If you have different types of content (products, articles, news, etc) you probably can differentiate them by the url (aka "pagepath").
You can then add a widget with "the top 5 Products", filtering by /product in the pagepath filter. You will also get the authors of those products!
We'll add the pageviews next to each product.
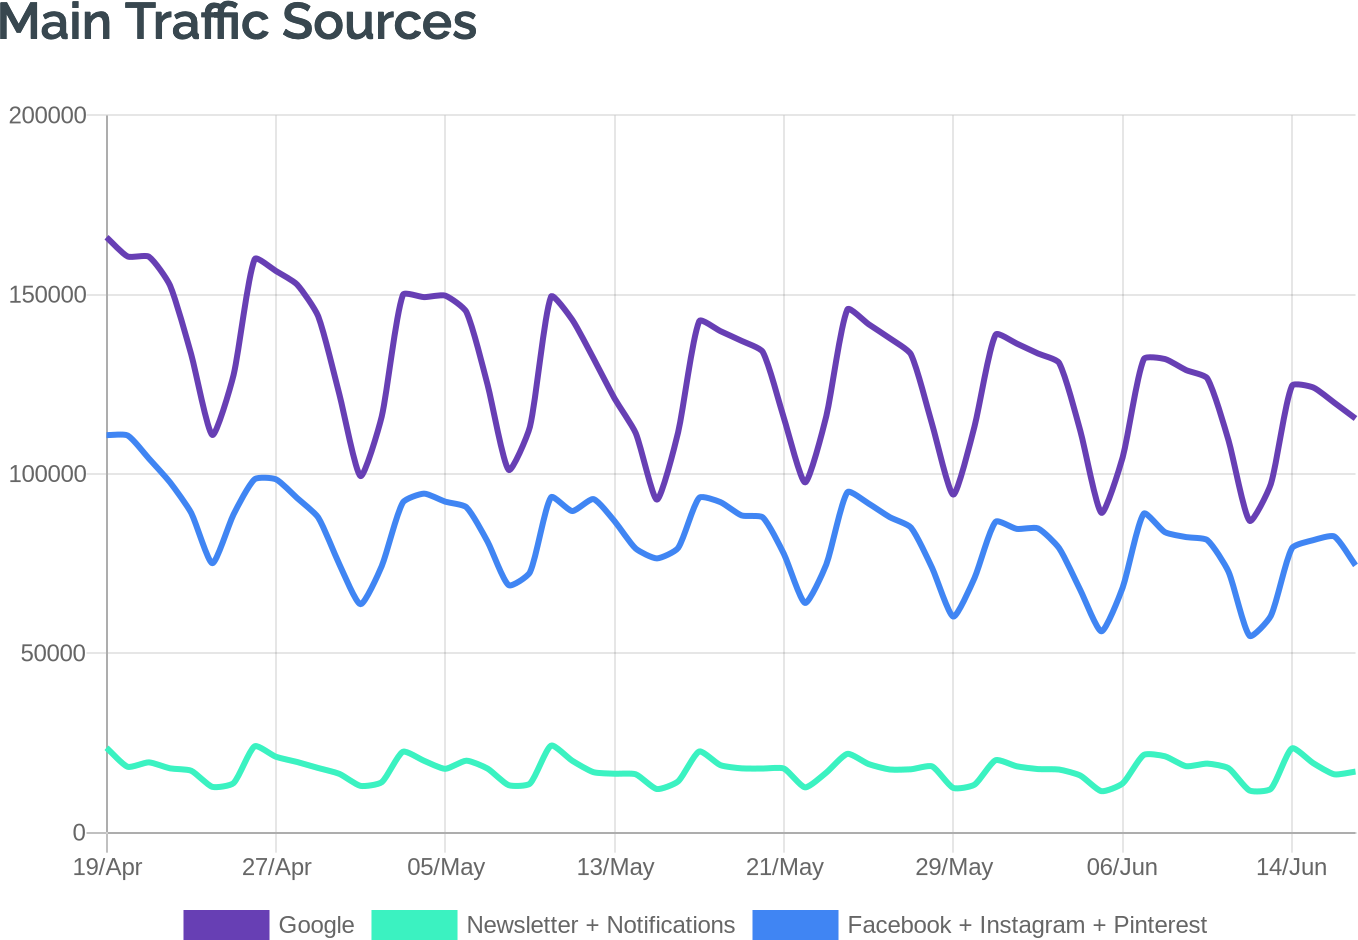
Main traffic sources
You can use the Multi Chart widget and set each serie with one specific source you want to track. For example, you can monitor "Google", your "Newsletter" and "Facebook".
You can basically visualise any metric you want from Fathom: Browsers, Countries, UTM campaigns, etc.
We've seen some customers using this chart to see very cool funnels too, using one serie with "/products", the second serie with "/cart" and the third one with "/thanks"

See the photo of that brilliant article
Once again, you can add any filter you want to this widget (filter by source equals to 'Google' and see the image of the most visited page from Google)
It will also help you to check how your most visited content looks like when shared on social networks as we use the same "opengraph image" that those platforms use.
And a little bit of extra information: See the main sources of that page to understand how did it become the most visited content. HackerNews? Producthunt? Find it there!
Celebrate when you break a new record!
One of our favourite features: that little medal that means you've broken a record.
This will definitely start a casual conversation within your team, celebrating a new milestone for the project <3


